
Sailing In Tariff Shock
What’s behind the numbers?
The third U.S. CPI release of the Jubilee Year declined by 0.1% month-on-month, below expectations of a +0.1% increase and February’s +0.2% gain. Year-on-year, CPI rose by +2.4%, missing the +2.5% forecast, slowing from February’s +2.8% and matching last September yearly level. This marked the first monthly deflation since May 2020. Energy was the primary deflationary driver, while core goods remained in deflation but to a lesser extent than the previous month. Meanwhile, food prices accelerated, posting the largest monthly increase since October 2023. Core services saw their smallest month-on-month rise since December 2021.
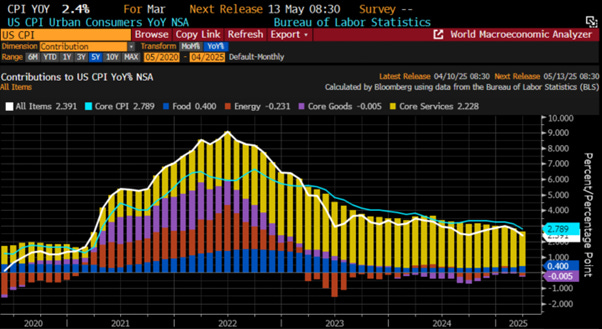
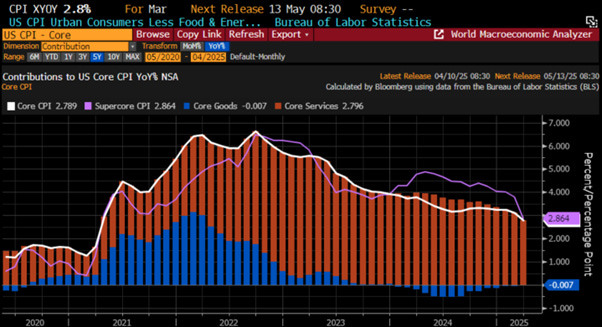
The core CPI rose by 0.1% month-on-month in March, below expectations of +0.3% and February’s +0.2% increase. On a year-on-year basis, core CPI climbed 2.8%, missing the +3.0% forecast and down from February’s 3.1%, marking the lowest annual increase since March 2021. Core services, which account for 76% of the core CPI, slowed from +3.13% YoY to +2.79%, while core goods remained deflationary year-on-year, albeit less so than in previous months. Notably, this marks the 58th consecutive month of monthly core CPI increases.
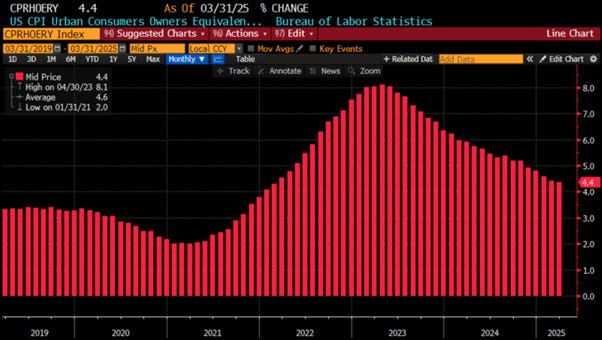
As a less encouraging sign for those convinced inflation is behind us, Owners' Equivalent Rent (OER), a key gauge of inflation persistence, rose 4.4% year-on-year in March, matching February’s pace.
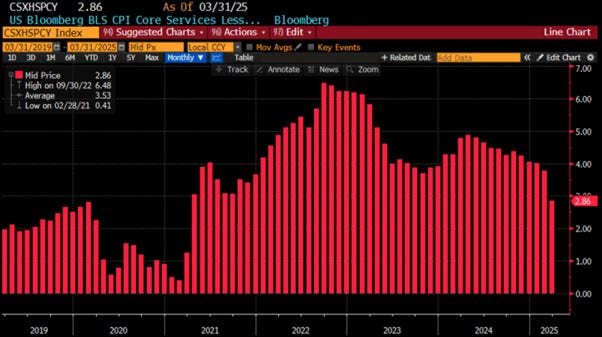
More encouraging for those proclaiming victory over inflation, SuperCore CPI , Core Services less housing, rose 2.86% YoY in March, down from 3.78% in February and the lowest since December 2021. Still, it remains well above a level that would mark mission accomplished, a reality that should trouble any Fed chair claiming to fight inflation for the good of the American people.
Thoughts.
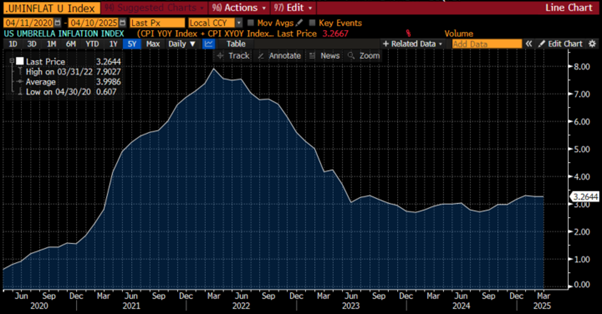
March's CPI report may give the illusion of inflation under control, but it was calculated before the 'Liberation Day tariffs' kicked in—enter the 'Trump-Re-Flation' era. As the U.S.-China trade war rages on and new inflationary policies take hold, either consumers or producers will foot the tariff bill, while tighter immigration policies stir up a service-sector reflation. So, while the ‘Manipulator in Chief’ and the ‘Central Banker In Chief’ claim victory, the reality is the umbrella inflation index is up 3.26% YoY, with no sign of hitting the elusive 2% target.
US Umbrella inflation Index (Average of CPI; Core CPI; PPI; Core PPI; Core PCE, 1-year consumer inflation expectations)
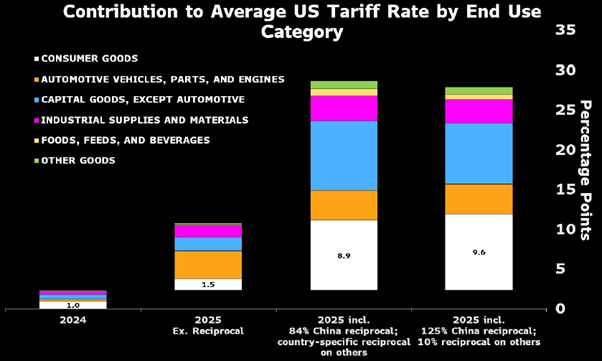
The Trump administration hiked tariffs on China twice in early 2025, lifting the effective rate to 30% on $450 billion worth of imports, because nothing says “winning” like taxing consumers or businesses. March CPI already showed this genius move, especially in kitchenware, toys, clothes, and phones. Then came the April 2 tariff bazooka, another 17-point spike, only to be “paused” a week later (except for China, of course), locking in a mere 125% tariff on Chinese goods. So yes, Americans consumers and businesses will now heroically pay more for everyday items, all in the name of Making America Great Again.
Rather than clinging to the fairy tale that 2% inflation is just around the corner (before the end of the Jubilee Year, give or take a miracle), savvy investors, clearly more grounded than the army of PhDs at the Fed and Wall Street, know better. Especially with that “most beautiful word in the English language” (tariffs, of course) still waiting to hit consumer wallets like a delayed punchline.
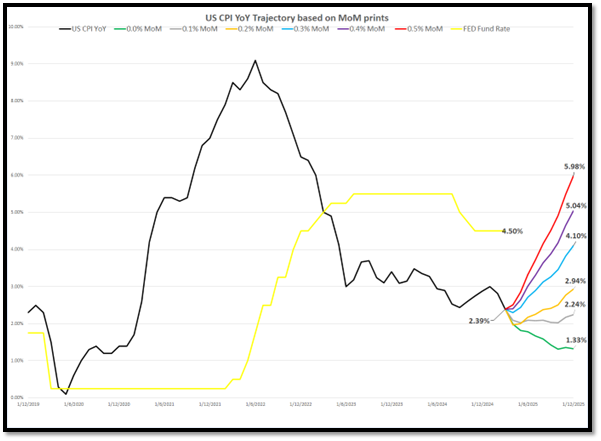
Anyone with a passing familiarity with base effects can do the math:
To hit 2% by end-2025, CPI would need to tiptoe in at under 0.1% monthly, basically a statistical unicorn.
If monthly prints creep up to 0.2% or more, we’re looking at year-end CPI anywhere between 2.94% and 6.0%.
In that case, the FED may have to sheepishly admit that easing policy during an inflationary boom wasn’t exactly a masterclass in central banking, unless the goal was to win the partisan policy limbo contest.
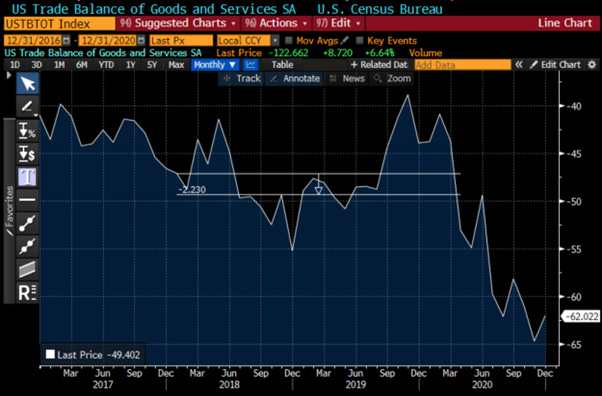
Before assuming reciprocal tariffs will reduce the US trade deficit, it's worth examining the first ‘Disruptor In Chief’ administration’s experience between 2016 and 2020. In January 2018, tariffs were imposed on solar panels, washing machines, steel, and aluminium, affecting 4.1% of U.S. imports. This led to a trade war, particularly with China, and retaliatory tariffs from countries like India, Canada, and China. Despite this, the U.S. trade deficit remained largely unchanged from January 2018 to March 2020, before COVID disruptions.
US Trade Balance of Goods & Services between December 2016 and December 2020.
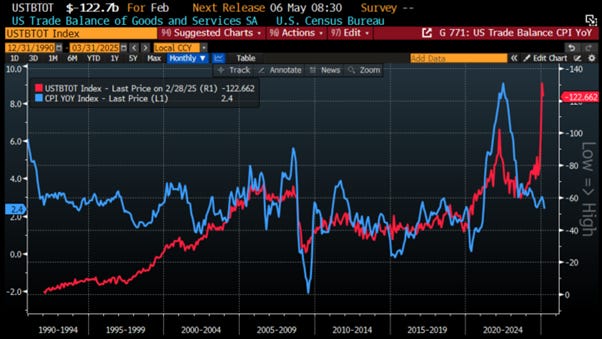
It should come as no surprise that when the US trade balance improves, it has historically triggered a slowdown in the CPI YoY change over the past 35 years,.
US CPI YoY Change (blue line); US Trade Balance of Goods & Services (axis inverted; red line).
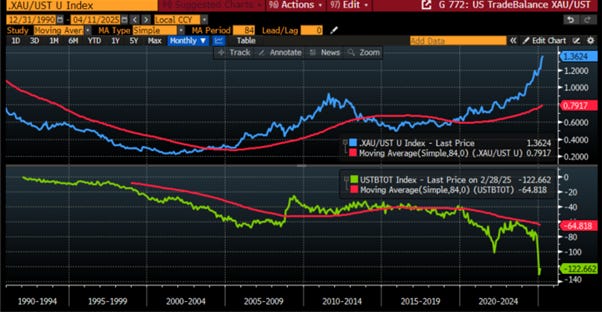
However, investors know that rather than relying on the ‘CP-Lie’ to assess whether an economy is in an inflationary or deflationary phase of the business cycle, they should look at whether government bonds are a good store of value compared to the ultimate antifragile asset, Gold. Examining the relationship between the US Trade Balance of Goods and Services and the Gold-to-Bond ratio against its 7-year moving average, it’s clear that a break of the Gold-to-Bond ratio above its 7-year moving average has historically coincided with an acceleration of US trade deficits.
Upper Panel: Gold to US Bond Ratio (blue line); 7-Year Moving Average Gold to US Bond Ratio (red line); Lower Panel: US Trade Balance of Goods & Services (green line); 7-Year Moving Average US Trade Balance of Goods & Services (red line).
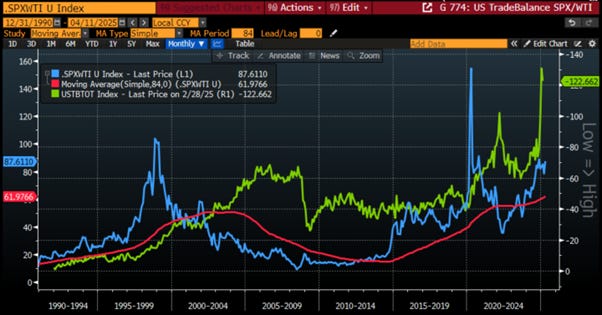
In short, assuming that reciprocal tariffs will reduce the US trade deficit overlooks the fact that trade balance is more a reflection of the economy's wealth than trade barriers. Those familiar with the business cycle, particularly using market data like the S&P 500 to Oil ratio and its position against the 7-year moving average, know that when the S&P 500 to Oil ratio falls below this average, it signals an improvement in the US trade deficit, as seen in 2022. This makes sense: when the US economy struggles, less goods are imported.
S&P 500 Index to Oil Ratio (blue line); 7-Year Moving Average S&P 500 to Gold Ratio (red line); US Trade Balance of Goods & Services (axis inverted; green line).
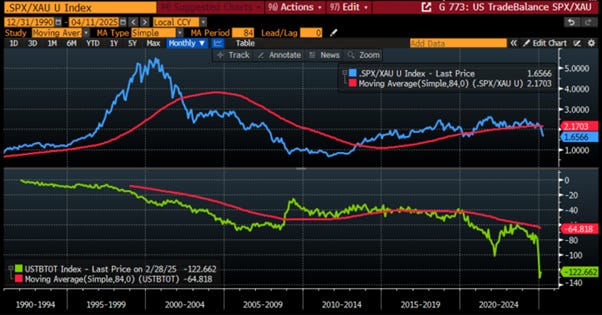
Looking at the relationship between the trend in the US Trade Balance and the S&P 500-to-Gold ratio, which serves as a leading indicator of monetary illusion, it’s clear that a break of the US Trade Balance of Goods & Services below its 7-year moving average has historically catalysed the spread of monetary illusion, signalling the shift from boom to bust in the economy.
Upper Panel: S&P 500 Index to Gold Ratio (blue line); 7-Year Moving Average S&P 500 to Gold Ratio (red line); Lower Panel: US Trade Balance of Goods & Services (green line); 7-Year Moving Average US Trade Balance of Goods & Services (red line).
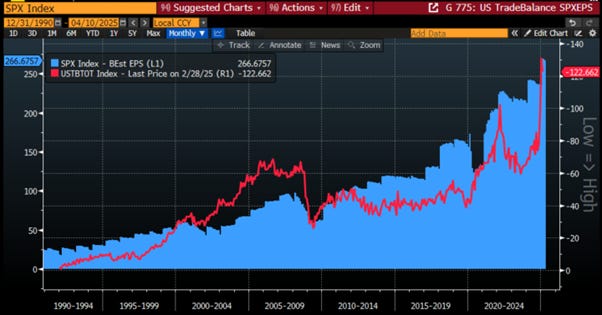
Everyone with a basic understanding of economics knows that the expansion of the US trade deficit over the years has been primarily driven by corporate America exiting the US due to increasingly bureaucratic regulations, high manufacturing costs, and absurd taxation imposed by various presidents, whether blue or red, to finance reckless government spending. On that note, no one will be surprised to see that the profitability of corporate America (i.e., 12-month Forward S&P 500 EPS) and the evolution of the US trade deficit have been highly negatively correlated.
S&P 500 12-Month Forward EPS (blue histogram); US Trade Balance of Goods & Services (axis inverted; red line).
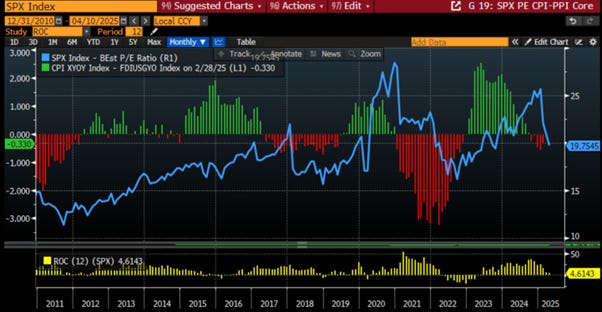
At the end of the day, those who have seriously studied macroeconomic data and its relationship to financial markets know that not only is inflation beneficial for the profitability of corporate America, but more importantly, the ability of US corporations to pass higher input prices onto their customers has been a key driver of valuation expansion and ultimately positive equity returns.
S&P 500 12-Month Forward P/E (blue line); Spread between Core US CPI YoY change and Core PPI YoY Change (histogram); S&P 500 12-Month Rate of Return (Yellow histogram).
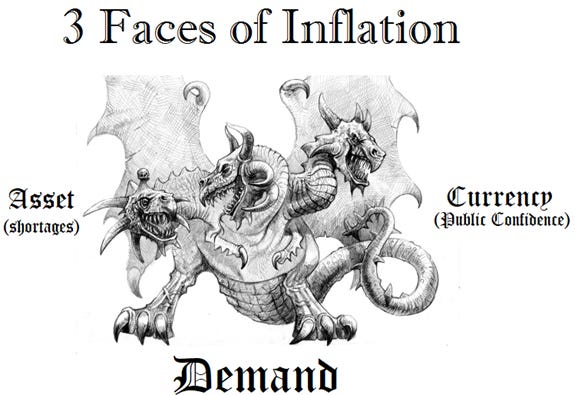
The misguided theories about inflation, tariffs and currency manipulation are as outdated as they are absurd as a way to solve the issues of imbalanced trade relationships. At the end of the day, inflation arises from three causes—shortages, demand, and lack of confidence, and in this context, tariffs, trade wars, and the threat of imperialistic behaviour from the U.S. will only exacerbate shortages and erode global confidence in public institutions, first abroad and ultimately in the US itself. The economy is and will always be the biggest factor in government approval. Trump will quickly lose support if his tariff measures lead to inflation, and you can forget it if he actually sent Americans back to the Middle East to satiate his colonialist property dreams.
Tariffs don't consider currency exchange rates or capital flows, which influence trade deficits by strengthening the USD when foreign investment pours into US assets. Imposing tariffs raises import costs, hurting industries that rely on foreign goods and ultimately leading to higher production costs, job losses, and consumer price hikes. The assumption that tariffs will close trade deficits ignores the complexities of trade wars, which aren't linear or reciprocal.

Ultimately, the key to global stability lies in "mercantilist free trade," and reciprocal trust is needed to cement this trade. Tariffs will not eliminate the use of USD assets as a weapon against countries that do not comply with "US Trumperialism." What recent US geopolitical decisions have enabled is the formation of an unlikely alliance between Russia, China, and India, combining Russia's access to cheap and abundant commodities, China's state-of-the-art manufacturing capabilities, and India's emerging consumer economy. To illustrate how U.S. policies have shifted over the past two decades: in 2004, when the tsunami struck South and Southeast Asia, the U.S. provided more aid than all other countries combined. In contrast, following the devastating 7.7 magnitude earthquake in Myanmar on March 28th, while the country was still digging out its dead, all it received from the U.S. was a 44% tariff. Meanwhile, Russia, China, and India sent emergency teams to search for survivors.
The China India Russia alliance can be represented by what has been named the Valeriepieris Circle. The Valeriepieris Circle is a geographic concept highlighting that over half of the world’s population resides within a circle around the South China Sea, covering key economies like China, India, Asian Russia, and Indonesia, along with emerging markets such as Vietnam, the Philippines, and Thailand. This region, home to the majority of the global labour force and consumer base, is a manufacturing and technology hub, driving global demand and supply chains. As these nations urbanize and expand their middle classes, the Valeriepieris Circle is becoming the centre of global economic growth, reshaping investment and geopolitical strategies. Understanding this region is crucial for grasping the future of economic power.

Read more and discover how to trade it here: https://themacrobutler.substack.com/p/sailing-in-tariff-shock
If this research has inspired you to invest in gold and silver, consider GoldSilver.com to buy your physical gold:
https://goldsilver.com/?aff=TMB

Disclaimer
The content provided in this newsletter is for general information purposes only. No information, materials, services, and other content provided in this post constitute solicitation, recommendation, endorsement or any financial, investment, or other advice.
Seek independent professional consultation in the form of legal, financial, and fiscal advice before making any investment decisions.
Always perform your own due diligence.